03 Mar A Market Perspective on Recent Middle East Events
Over the weekend, the U.S. and Israel launched coordinated military strikes against Iran, targeting senior leadership, military infrastructure, and components of its nuclear program. Iran’s Supreme Leader has reportedly been killed, and Iran has responded with missile and drone attacks across the region. President Trump has labeled the campaign “Operation Epic Fury,” with the stated objective of regime change in Tehran. Strikes are expected to continue, and there are already reports of U.S. casualties.
First and foremost, the human element matters. The safety of civilians and our troops is paramount. These are serious developments with real-world consequences.
At the same time, as investors, we have to assess what this means for markets, not emotionally, but analytically.
When geopolitical shocks occur, markets typically react through three primary channels: risk sentiment shifts, energy prices move, and volatility rises. The key question is not whether markets react — they always do. The key question is whether this evolves into a sustained macroeconomic shock, or remains a contained geopolitical escalation with temporary market implications.
This Was Building
While the scope of the strikes is significant, particularly the targeting of Iran’s senior leadership, tensions did not appear overnight.
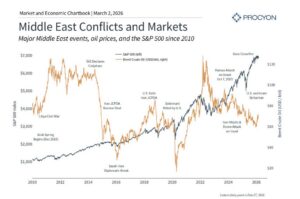
Iran’s adversarial posture toward the U.S. and Israel has spanned decades. In 2019, Iran attacked Saudi oil infrastructure, temporarily disrupting global supply. Hamas’ October 2023 attack on Israel reignited broader regional conflict and heightened direct tensions with Iran. Last summer, Israel conducted a 12-day campaign targeting Iranian nuclear and missile assets. Nuclear negotiations failed in recent months, and a visible U.S. military buildup suggested escalation risk was rising.
In other words, this was a progression, not a bolt from the blue. Markets tend to struggle with true surprises. They often digest well-telegraphed risks more effectively than feared. We saw this in the market’s resilience in the Monday following the attacks.
The Energy Transmission Mechanism
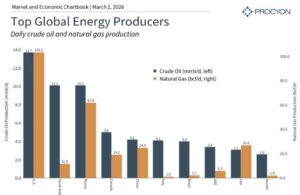
For markets, the most direct variable is oil. Iran produces roughly 3 million barrels per day and sits along the Strait of Hormuz — one of the most critical energy chokepoints in the world. Roughly one-third of global seaborne oil exports pass through that narrow corridor. Even the threat of disruption can push prices higher.
Following the strikes, WTI moved into the low $70s and Brent approached $80. That’s a clear reaction, but context matters.
Oil peaked near $128 in 2022 following Russia’s invasion of Ukraine. We are materially below those levels today. More importantly, the structural backdrop has shifted. The U.S. is now the world’s largest producer of oil and natural gas. While we remain part of a global energy market, domestic production meaningfully reduces vulnerability relative to prior decades.
Energy shocks become economically problematic when they are severe, sustained, and layered on top of fragile growth. At present, none of those conditions are clearly in place. Could they develop? Yes. Is that the base case? No.
We saw a similar dynamic in 2022 where consensus expected structurally higher oil prices for years. Instead, supply adjusted and prices normalized faster than projected.
What History Tells Us
A common behavioral mistake during geopolitical crises is extrapolation. Assuming that severe headlines translate into permanent market damage.
History does not support that view.
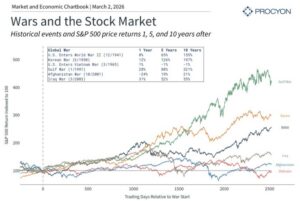
Markets have navigated world wars, the Gulf War, 9/11, the wars in Iraq and Afghanistan, Russia’s invasion of Ukraine, and the Israel–Hamas conflict. Each episode brought volatility. None permanently derailed long-term market compounding.
Markets ultimately price earnings, liquidity, policy, and productivity. Geopolitical events matter to the extent that they alter those drivers.
In many historical cases, markets bottomed while headlines remained negative. Waiting for clarity has often meant missing the recovery.
Portfolio Impact
It’s also important to separate emotional intensity from portfolio exposure.
Iran has been under heavy sanctions for years, and its economy is relatively isolated from global capital markets. Direct exposure within diversified portfolios is minimal.
The real risks are second-order: sustained energy inflation, shipping disruptions, broader regional escalation, or policy responses that tighten financial conditions. Those are macro variables we will be monitoring.
Our portfolios are built across asset classes, sectors, and geographies precisely because we cannot predict which shock will arrive next. Diversification is not theoretical — it is structural risk management.
Discipline Matters – Final Thoughts
Events like this test discipline more than analysis.
Military conflict carries emotional weight. But investment decisions made in emotionally charged environments tend to be the most costly.
Short-term volatility is uncomfortable. Permanent capital impairment is expensive.
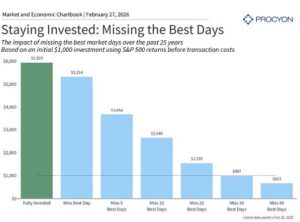
The data is clear: missing even a handful of the market’s strongest days materially reduces long-term returns. Those days often occur during peak uncertainty.
This does not mean ignoring risk. It means distinguishing between headline risk and structural economic deterioration. Right now, we are firmly in the headline phase.
The strikes on Iran represent a meaningful geopolitical escalation. The situation is fluid, and we are monitoring developments closely.
However, our framework does not change based on headlines. Diversified portfolios aligned with long-term financial plans are designed to endure periods of uncertainty.
We cannot predict every shock, but we can prepare for them through disciplined portfolio construction.
Discipline — not reaction — is what compounds wealth over time.
IMPORTANT DISCLAIMERS AND DISCLOSURES:
The information contained in this presentation has been gathered from sources we believe to be reliable, but we do not guarantee the accuracy or completeness of such information, and we assume no liability for damages resulting from or arising out of the use of such information. Past performance is not indicative of future results.
The views expressed in the referenced materials are subject to change based on market and other conditions. This document may contain certain statements that may be deemed forward‐looking statements. Please note that any such statements are not guarantees of any future performance and actual results or developments may differ materially from those projected. Any projections, market outlooks, or estimates are based upon certain assumptions and should not be construed as indicative of actual events that will occur. The information provided herein does not constitute investment advice and is not a solicitation to buy or sell securities.
Different types of investments involve varying degrees of risk, and there can be no assurance that the future performance of any specific investment, investment strategy, investment model, or products, including the investments, investment strategies or investment themes referenced herein, will be profitable, equal any corresponding indicated historical performance level(s), be suitable for a particular portfolio or individual situation, or prove successful. Due to various factors, including changing market conditions and/or applicable laws, the content may no longer be reflective of current opinions or positions.
Please note that nothing in this content should be construed as an offer to sell or the solicitation of an offer to purchase an interest in any security or separate account. Nothing is intended to be, and you should not consider anything to be direct investment, accounting, tax, or legal advice to any one investor. Consult with an accountant or attorney regarding individual accounting, tax, or legal advice. No advice may be rendered unless a client service agreement is in place.
Procyon Advisors, LLC is a registered investment advisor with the U.S. Securities and Exchange Commission (“SEC”). This report is provided for informational purposes only and for the intended recipient[s] only. This report is derived from numerous sources, which are believed to be reliable, but not audited by Procyon for accuracy. This report may also include opinions and forward-looking statements which may not come to pass. Information is at a point in time and subject to change.
For additional information, please visit our website at www.procyon.net.