
INVESTMENT STRATEGY OUTLOOK
Market Commentary
Corporate research and exhibits use data through October 31, 2026. The inflation discussion reflects the November 10 CPI release; our models were not rerun with that release. See “About This Report.”
Finding Value as Price Participation Broadens
In our view, corporate profits remain supportive, and persistent inflation and concentrated earnings gains make valuation, cash generation and diversification increasingly important.
We believe investors face a market in which encouraging business results do not guarantee attractive stock returns. Our research indicates that the economy continues to expand, corporate profits remain supported, and companies are still investing. Yet we believe some businesses must deliver substantial growth simply to meet the expectations already reflected in their share prices.
Our economic and corporate research leads us to favor continued equity participation with greater selectivity. We favor what we view as reasonably valued businesses with durable cash generation and financial strength, while looking beyond a narrow group of market leaders. Four themes shape that assessment.
1. The Expansion Appears to Be Continuing at a More Demanding Pace
October’s Institute for Supply Management (ISM) business surveys showed continued expansion in both manufacturing and services. New orders were still growing, although services new orders momentum had moderated over the preceding three months.
Slower growth in orders is not the same as falling orders: companies can keep producing, hiring and earning profits as demand becomes less vigorous. A slower pace of expansion may, however, leave businesses less room to absorb rising costs or disappointing sales.
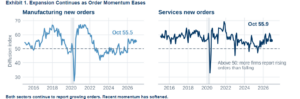
Source: Institute for Supply Management new orders indexes, monthly, January 2015 to October 2026. A reading above 50 means more firms reported rising orders than falling; the indexes do not measure order volumes. Shading marks the 2020 recession.
In our view, inflation adds to that challenge. Consumer prices rose 0.4% in October, following a 0.6% increase in September (seasonally adjusted; U.S. Bureau of Labor Statistics). Prices excluding food and energy rose 0.3% for a third consecutive month. The headline improvement reflected a much smaller increase in energy prices (0.7% in October after 5.2% in September); we believe underlying inflation remained persistent.
In our view, this combination places more responsibility on corporate execution. We are cautious about assuming that falling interest rates will lift valuations, or that stronger demand will compensate for weak cost control. The expansion remains the foundation of our equity view. Stronger orders and a sustained cooling in inflation would, in our view, make that foundation more comfortable.
2. Strong Aggregate Earnings May Conceal a Narrower Foundation
Earnings Forecasts Continue to Support the Expansion
Our corporate research continues to find support for the earnings expansion. In October, all three measures we track (changes in analysts’ forecasts for earnings per share, operating profit and free cash flow) remained positive. This marked the fourth consecutive month of confirmation across all three measures.
Earnings and operating-profit revision momentum eased for a second month, while cash-flow revisions held broadly steady. Analysts are still raising forecasts overall, although the pace of improvement has slowed. In our view, this supports continued equity participation and makes the breadth of future earnings gains increasingly important.
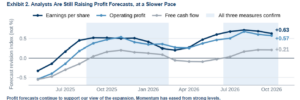
Source: FactSet; Procyon corporate research, October 31, 2026. Revision indices measure changes in analysts’ forecasts, not realized profit growth. May 2025 to October 2026. Indices are unit-free scores; values are not percentages or growth rates. Forecasts are estimates and may not be realized.
Fewer Industries Share in the Improvement
In our view, the distribution of that support deserves closer attention. The share of S&P 500 industries with rising operating-profit forecasts fell from about 74% in September to 59% in October. Over the same period, the share of industries with positive returns over the past 12 months rose from about 54% to 72%. More industries took part in the market’s advance even as fewer enjoyed improving profit forecasts.
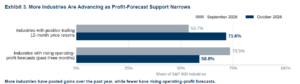
Source: our corporate research using FactSet data, September-end and October-end 2026. Both measures count S&P 500 industries, not companies. Price participation is the share of industries with positive trailing 12-month returns; forecast breadth is the share whose consensus operating-profit forecasts rose over three months. Forecasts are estimates and may not be realized.
Aggregate confirmation and narrowing industry support can coexist. Strong forecast increases in some industries can keep the overall measures positive even as fewer industries share in the improvement.
That divergence can resolve in two ways. Broader participation may anticipate an improvement in earnings beyond the established leaders. Alternatively, prices may have moved ahead of the fundamental evidence. Subsequent profit revisions will help distinguish between the two.
In our view, reported margins tell a related story. Among 378 S&P 500 companies outside Financials with comparable data a year apart, about 55% improved their net profit margin over the past year. The median improvement was about 0.2 percentage points, compared with about 2.3 points for the group in aggregate. The typical company’s improvement was much smaller than the aggregate result. Five companies, representing about 13% of the group’s revenue, accounted for nearly 90% of the aggregate improvement; excluding them, the aggregate margin rose about 0.5 percentage points.
In our view, for investors, the question is whether earnings growth becomes more widely supported. A broader set of businesses delivering stronger sales, operating profits and cash flow would, in our view, make the expansion less dependent on a few exceptional performers.
3. The AI Investment Cycle May Create Different Risks for Spenders and Suppliers
Artificial intelligence remains an important source of corporate investment. We believe its financial consequences may differ across the companies funding infrastructure, supplying equipment and using the technology to improve their businesses. For infrastructure suppliers, customer spending can create revenue opportunities. For the companies making those investments, the same spending consumes cash today in anticipation of future benefits, which are not assured. Both can report strong revenue growth while experiencing very different cash-flow outcomes.
Our October corporate research showed analysts raising earnings, operating-profit and cash-flow forecasts for the semiconductor and technology hardware industries, which include major suppliers of AI infrastructure; the research did not identify a broad semiconductor earnings downturn. At the same time, analysts lowered earnings, operating-profit and cash-flow forecasts for the Interactive Media & Services industry, and cash-flow forecasts for Broadline Retail, two industries that include several of the largest AI spenders. In our view, this raises questions about how quickly growing investment will translate into financial returns.
In our view, this helps explain why strong earnings alone may not protect a share price. Investors also reassess valuation, financing needs and the amount of future growth they are willing to pay for. Falling prices may reflect changing expectations before any operating downturn appears or may anticipate deterioration that forecasts have not yet captured.
We therefore assess the AI investment cycle through three questions:
➜ Are customers maintaining their investment commitments?
➜ Are suppliers maintaining orders, margins and profit forecasts?
➜ Are the companies funding the expansion generating sufficient cash and returns from that spending?
In our view, a long-term technology theme still requires investment discipline. We assess each business’s role in the spending cycle, the strength of its finances and the expectations embedded in its valuation.
4. Market Concentration Can Hide Opportunities Elsewhere
An index-level valuation can give an incomplete picture of the opportunities available to investors. Large companies carry the most weight in aggregate measures, even when smaller constituents offer different combinations of valuation and financial strength.
Our October analysis illustrates this dispersion. Free cash flow is the cash a business has left after paying its operating expenses and funding its capital investment. Among 354 eligible S&P 500 companies, the median company’s expected free-cash-flow yield was about 3.9%, compared with 3.1% for the group in aggregate. Expected free cash flow reflects consensus analyst forecasts, which may not be realized.
This yield compares expected free cash flow with enterprise value: the value of the operating business, including debt and net of cash. A higher yield means investors are paying less for each dollar of expected cash generation, although a higher yield may also reflect investor concerns about a company’s prospects. It is not a dividend yield or a promised investment return. The aggregate figure divides total forecast free cash flow by total enterprise value, so the largest companies carry the most weight.
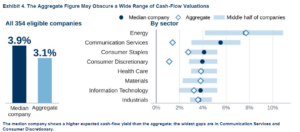
Source: our corporate research using FactSet data, October-end 2026. Expected free cash flow for the next fiscal year divided by enterprise value. 354 point-in-time S&P 500 companies, excluding Financials, Utilities and Real Estate. Aggregate = total forecast free cash flow / total enterprise value. Based on consensus forecasts, which may not be realized. The S&P 500 is an unmanaged index; one cannot invest directly in an index.
In our view, the valuation gap gives us a reason to look beyond the largest index constituents. We favor companies whose cash generation and earnings prospects we believe provide support for the price paid. These opportunities can appear across sectors and company sizes, including businesses usually associated with growth.
Our House View: Value, Balanced Sector Exposure and Selective Growth
As a house view, we favor value over growth within a diversified equity portfolio. We believe continued economic expansion supports remaining invested, while persistent inflation and demanding valuations strengthen our preference for businesses with established cash generation and reasonable prices.
We balance economically sensitive sectors with defensive businesses and low-volatility stocks. Selected industrial and materials companies may provide exposure to continued investment and economic activity. Health care and other businesses with more stable demand may provide a counterweight as growth moderates. Low-volatility exposure may add another source of balance, although it does not eliminate equity risk, and low-volatility strategies may underperform in rising markets.
We retain a role for growth and technology within diversified portfolios. These businesses in our view remain important sources of innovation and earnings growth. Our emphasis is on the price paid, the durability of demand and the cash required to finance expansion. We favor selective participation and seek to avoid allowing one investment theme to dominate the portfolio. Growth and value styles may each underperform at different points in the market cycle.
In our view, diversification across company sizes and international markets may complement this approach. The objective is to participate in the expansion through a broader set of earnings drivers, with a deliberate balance between opportunity and resilience. International investing involves additional risks, including currency fluctuations and political and economic instability, and smaller companies may be more volatile and less liquid than larger companies. Diversification and asset allocation do not ensure a profit or protect against loss.

In our view, for fixed income, the same backdrop calls for attention to credit quality and interest-rate sensitivity. Longer-maturity bonds can provide meaningful gains if yields fall, alongside greater losses if yields rise. We believe any decision to extend maturity should reflect the portfolio’s income needs, risk capacity and investment horizon. Fixed income investments are subject to interest-rate, credit, inflation and liquidity risks, and bond prices generally fall when interest rates rise.
What Would Change Our View?
We would become more constructive if stronger orders were accompanied by broader upward profit revisions, healthier cash-flow forecasts and sustained cooling in inflation.
We would become more defensive if weaker demand spread into corporate earnings and cash flow, particularly alongside tighter credit conditions. Within AI infrastructure, investment deferrals and sustained cuts to supplier forecasts would, in our view, carry more weight than price weakness alone.
Our confidence in continued expansion is moderate. The strongest evidence, in our view, remains the agreement between economic activity and aggregate corporate earnings. We view the main vulnerability as a narrowing base of earnings support while inflation remains persistent.
We favor continued equity participation, emphasizing value, durable cash generation and a balance of cyclical and defensive businesses.
About This Report
Our research combines business surveys, inflation and financing conditions with corporate profit forecasts, cash flows and valuations. This report reflects the October research cycle. Corporate research and exhibits use data through October 31, 2026, for point-in-time S&P 500 members; the November 10 CPI release is reflected in the inflation discussion only, does not update corporate forecasts, and our models were not rerun with it. The views herein may not reflect developments after October 31, 2026, other than the November 10 CPI release.
Margin analysis: 378 S&P 500 companies outside Financials with comparable data in October 2025 and October 2026; the aggregate is total net income divided by total revenue, and each company’s contribution is its effect on that ratio. Valuation analysis: 354 eligible S&P 500 companies, excluding Financials, Utilities and Real Estate; yield is next fiscal year’s expected free cash flow divided by enterprise value, and the aggregate is total forecast free cash flow divided by total enterprise value. Earnings support: aggregate indices of three-month changes in analysts’ forecasts for earnings per share, operating profit and free cash flow; they are indices, not growth rates. Industry measures weight each company in an industry equally and are not attributed to individual companies.
Data: FactSet, S&P Global Compustat, Institute for Supply Management and U.S. Bureau of Labor Statistics. Forecasts can change, research findings reflect Procyon’s opinions and are not individualized recommendations, and models do not guarantee outcomes. Third-party data are believed to be reliable but have not been independently verified by Procyon, and are used subject to each provider’s terms. The S&P 500 Index is unmanaged, does not reflect fees, expenses or transaction costs, and cannot be invested in directly.
IMPORTANT DISCLAIMERS AND DISCLOSURES:
The information contained in this report has been gathered from sources we believe to be reliable, but we do not guarantee the accuracy or completeness of such information. Nothing herein is intended to waive or limit any right a client may have under federal or state securities laws. Past performance is not indicative of future results.
The views expressed in this report are the opinions of Procyon Advisors, LLC as of the date of publication and are subject to change without notice based on market and other conditions. This document contains opinions and forward-looking statements. Please note that any such statements are not guarantees of any future performance and actual results or developments may differ materially from those projected. Any projections, market outlooks, or estimates are based upon certain assumptions and should not be construed as indicative of actual events that will occur. The information provided herein is general in nature, is not tailored to the investment needs of any particular investor, does not constitute individualized investment advice and is not a solicitation to buy or sell securities.
Different types of investments involve varying degrees of risk, and there can be no assurance that the future performance of any specific investment, investment strategy, investment model, or products, including the investments, investment strategies or investment themes referenced herein, will be profitable, equal any corresponding indicated historical performance level(s), be suitable for a particular portfolio or individual situation, or prove successful. Due to various factors, including changing market conditions and/or applicable laws, the content may no longer be reflective of current opinions or positions. Investing involves risk, including the possible loss of principal.
Topic-specific risks. Fixed income investments are subject to interest-rate risk (bond prices generally fall as interest rates rise), credit risk, inflation risk, call risk and liquidity risk. Value and growth investment styles may each underperform the broader market, and a value-oriented approach may hold securities that remain undervalued for an extended period. Low-volatility strategies may lag in strongly rising markets and do not eliminate the risk of loss. Smaller companies may be more volatile and less liquid than larger companies. International investments involve additional risks, including currency fluctuation, political and economic instability, and differing accounting and regulatory standards. Concentrating investments in a sector or theme, such as technology or artificial intelligence, may increase volatility and the risk of loss. Diversification and asset allocation do not ensure a profit or protect against loss.
Index and third-party data. The S&P 500 Index is unmanaged and cannot be invested in directly; index returns do not reflect fees, expenses or transaction costs. Third-party data (FactSet, S&P Global Compustat, the Institute for Supply Management and the U.S. Bureau of Labor Statistics) are believed to be reliable but have not been independently verified by Procyon and are subject to the providers’ terms and conditions. Analyst forecasts and consensus estimates are opinions of third parties, may change without notice and may not be realized.
Please note that nothing in this content should be construed as an offer to sell or the solicitation of an offer to purchase an interest in any security or separate account. Nothing is intended to be, and you should not consider anything to be direct investment, accounting, tax, or legal advice to any one investor. Consult with a qualified investment professional, accountant or attorney regarding your individual investment, accounting, tax or legal situation. No advice may be rendered unless a client service agreement is in place.
Procyon Advisors, LLC is an investment adviser registered with the U.S. Securities and Exchange Commission (“SEC”). Registration does not imply a certain level of skill or training. This report is provided for informational purposes only and for the intended recipients only and may not be reproduced or redistributed without Procyon’s written consent. This report is derived from numerous sources, which are believed to be reliable, but not audited by Procyon for accuracy. This report also includes opinions and forward-looking statements which may not come to pass. Information is at a point in time and subject to change without notice.
For additional information, please visit our website at www.procyon.net. Procyon’s Form ADV Part 2A, which describes its services, fees and conflicts of interest, is available upon request.