
14 Jul Global Equity Outlook
Selective Strength, Steady Conviction
The reflationary backdrop that favored value, cyclicals, and emerging markets earlier this year remains intact. Growth is expanding, inflation is firm, risk appetite is healthy, and the yield curve is positive and steepening. These are the conditions that have historically rewarded economically sensitive positioning.
What has changed is how the opportunity is being expressed. The broad regional posture has not shifted: the allocation remains overweight US equities, with meaningful developed international and emerging market exposure. But inside the portfolio, the emphasis has become more selective. International exposure now favors quality over momentum. US sector exposure has rotated from growth-oriented cyclicals into energy and more defensive sectors. And within emerging markets, the country mix has shifted toward Latin America.
This is not a retreat from the reflationary thesis. It is a refinement of it. The data still supports a pro-cyclical stance, but conditions are more mature than they were two months ago. Markets have priced much of the good news, and the model is responding with greater selectivity rather than broader risk-taking.
What the Market Environment Favors
The current backdrop continues to favor a pro-cyclical orientation, but one that balances conviction with discipline. That means tilting toward:
‣Value over Growth: Value stocks remain the strongest factor signal. Firm inflation and broadening economic growth continue to support companies trading at attractive valuations relative to their fundamentals, across both US and international markets.
‣Energy and Selective Defensives: Energy remains a natural fit for a reflationary environment. The addition of defensive sectors such as Consumer Staples and Utilities reflects a more balanced posture rather than a loss of conviction in the cycle.
‣International Exposure with a Quality Tilt: Developed international and emerging market equities continue to merit meaningful weight. The shift is in emphasis: international exposure now favors quality-oriented companies over pure momentum, a choice consistent with a more mature phase of the expansion.
‣Emerging Markets, Tilted Toward Latin America: Total emerging market exposure is unchanged, but the country mix now emphasizes Brazil and Latin America. These markets carry strong economic linkages to the global reflationary theme.
What Changed This Month
The most important message is what did not change. The broad regional split across US, developed international, and emerging market equities is the same as last month. Total emerging market exposure is unchanged. The model has not stepped back from global equity participation.
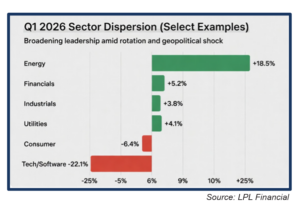
The changes were internal, and they matter. International equity exposure rotated from a momentum-oriented strategy to a quality-oriented one. US sector exposure shifted from Technology, Industrials, and Consumer Discretionary into Energy, Consumer Staples, and Utilities. And within emerging markets, South Korea was replaced by Brazil.
Read together, the signal is clear: the model is maintaining its reflationary allocation but expressing it with more balance. Risk is being taken in different places, not in different amounts.
Why This Positioning Makes Sense
The Economic Backdrop
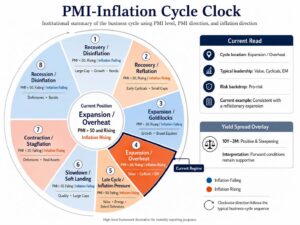
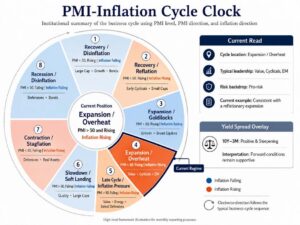
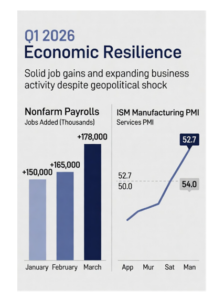
Growth momentum remains positive. Manufacturing activity sits above 50 and is still rising, with a weighted PMI of 53.9 and services activity at 54.0. Inflation is firming at roughly 4.1% year-over-year, and the yield curve maintains a positive, steepening slope. These are the conditions that historically support risk-taking in equities and favor value, cyclicals, and emerging markets.
The macro regime remains classified as Expansion / Overheat on the cycle clock. That is constructive territory, though it is also a regime where valuation and rate sensitivity carry more weight.
Corporate Earnings Are Strong
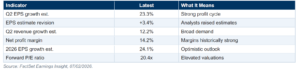
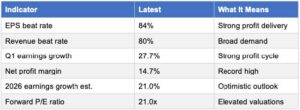
Earnings continue to be a primary support for equity risk appetite. Estimated year-over-year S&P 500 earnings growth for the second quarter stands at 23.3%, which would mark the second consecutive quarter above 20%. Revenue growth is estimated at 12.2%, and net margins remain historically strong at 14.2%.
Ten of eleven sectors are expected to report year-over-year earnings growth, led by Energy, Information Technology, and Materials. The caveat is concentration and valuation: much of the improvement remains concentrated in a handful of sectors, and forward multiples leave less room for disappointment.
Market Conditions Support Measured Risk-Taking
The risk environment remains supportive. Equity volatility is contained with the VIX at 16, credit spreads are tight, and the overall risk composite reads as risk-on. These are not conditions associated with defensive stress.
The most constructive signal comes from market internals: emerging market cyclicals are outperforming their defensive counterparts by a wide margin, and the same pattern holds in developed international markets. US cyclical leadership, however, has faded to near-flat. That divergence is part of what is driving the more balanced posture.
The US dollar is neutral rather than weakening, which means liquidity support for international equities is less powerful than earlier in the year. The model has responded accordingly: it retains international and emerging market exposure but expresses it through quality and commodity-linked markets rather than broad momentum.
What Could Derail This Setup
The positioning is compelling, but it is not without risk. A pro-cyclical stance built around value, energy, and emerging markets creates vulnerability if the conditions supporting those areas reverse.
The primary risk scenario: a further acceleration in inflation that drives bond yields sharply higher and strengthens the US dollar. This combination would pressure emerging markets, cyclicals, and international equities disproportionately.
Specific warning signs to monitor:
‣US dollar breaking higher, creating headwinds for international and emerging market equities
‣10-year Treasury yields spiking above current levels, challenging valuations and yield-sensitive sectors
‣High-yield credit spreads widening, signaling deteriorating risk appetite
‣Manufacturing PMI rolling over, weakening the growth thesis
‣Defensive stocks beginning to outperform cyclicals, signaling a shift in market sentiment
‣Emerging markets losing relative strength versus developed markets
‣Earnings revision breadth narrowing further, reducing bottom-up confirmation
Any combination of deteriorating growth, tightening liquidity, rising yields, widening credit spreads, or renewed dollar strength would hit cyclical positioning hard. These are not distant theoretical risks; they are the specific conditions that would invalidate the current opportunity. Monitoring them remains essential.
The Bottom Line
The reflationary backdrop remains in place, and the data continues to favor value, cyclicals, and emerging markets. Growth is expanding, earnings are strong, risk appetite is healthy, and markets are still rewarding economically sensitive positioning.
What has changed is the degree of selectivity. Markets have priced much of the reflationary expansion, and the allocation has responded by shifting from broad momentum toward quality, energy, and defensive balance. The regional risk allocation is unchanged, but the internal composition is more disciplined.
The core task remains the same: watching the macro drivers that justify the stance. If growth momentum fades, if credit conditions tighten, if the dollar reverses higher, the positioning needs to shift with it. For now, the opportunity remains compelling, and the conditions are in place to capture it.
IMPORTANT DISCLAIMERS AND DISCLOSURES:
The information contained in this presentation has been gathered from sources we believe to be reliable, but we do not guarantee the accuracy or completeness of such information, and we assume no liability for damages resulting from or arising out of the use of such information. Past performance is not indicative of future results.
The views expressed in the referenced materials are subject to change based on market and other conditions. This document may contain certain statements that may be deemed forward-looking statements. Please note that any such statements are not guarantees of any future performance and actual results or developments may differ materially from those projected. Any projections, market outlooks, or estimates are based upon certain assumptions and should not be construed as indicative of actual events that will occur. The information provided herein does not constitute investment advice and is not a solicitation to buy or sell securities.
Different types of investments involve varying degrees of risk, and there can be no assurance that the future performance of any specific investment, investment strategy, investment model, or products, including the investments, investment strategies or investment themes referenced herein, will be profitable, equal any corresponding indicated historical performance level(s), be suitable for a particular portfolio or individual situation, or prove successful. Due to various factors, including changing market conditions and/or applicable laws, the content may no longer be reflective of current opinions or positions.
Please note that nothing in this content should be construed as an offer to sell or the solicitation of an offer to purchase an interest in any security or separate account. Nothing is intended to be, and you should not consider anything to be direct investment, accounting, tax, or legal advice to any one investor. Consult with an accountant or attorney regarding individual accounting, tax, or legal advice. No advice may be rendered unless a client service agreement is in place.
Procyon Advisors, LLC is a registered investment advisor with the U.S. Securities and Exchange Commission (“SEC”). This report is provided for informational purposes only and for the intended recipient[s] only. This report is derived from numerous sources, which are believed to be reliable, but not audited by Procyon for accuracy. This report may also include opinions and forward-looking statements which may not come to pass. Information is at a point in time and subject to change.
For additional information, please visit our website at www.procyon.net.


 Inflation dynamics evolved meaningfully over the course of the quarter. Early in Q1, headline inflation remained relatively contained, with CPI at 2.4% year-over-year and core PCE around 3.1%. However, the late-quarter oil shock introduced a new source of pressure. Rising energy costs fed through to input prices, contributing to a repricing of inflation expectations and a modest increase in bond yields.
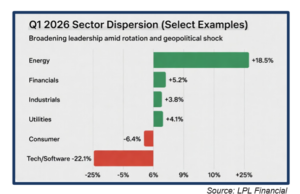 The late-February Iran conflict escalation and Strait of Hormuz disruptions created a classic supply-shock scenario, spiking oil and commodities while initially pressuring risk assets. Despite this, markets proved resilient: