16 Apr Rotation, Resilience, and Fundamentals Amid Geopolitical Shock
Executive Summary
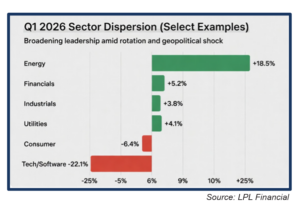
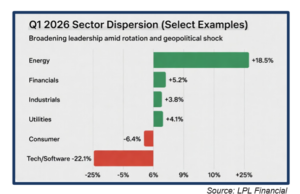
Q1 2026 ultimately reflected a rotation-driven market under a temporary inflation shock, rather than a deterioration in underlying economic fundamentals. While the S&P 500 declined 4.3% over the quarter, leadership broadened meaningfully across small caps, value, international equities, and commodities, cushioning diversified portfolios and highlighting the benefits of diversification.
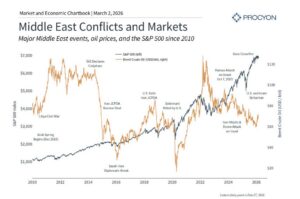
The dominant late-quarter event was the escalation of conflict involving Iran and the resulting disruptions in the Strait of Hormuz. This triggered a sharp rise in oil prices, a rapid repricing of inflation expectations, and a rotation away from duration-sensitive mega-cap growth. However, the subsequent truce and equally sharp reversal in oil prices suggest that this “overheat” phase was externally induced and is now beginning to unwind.
Importantly, the U.S. economy remained resilient throughout this period. Labor markets held firm, business activity remained in expansion, and corporate earnings expectations continued to improve. As the inflation shock fades, the macro regime appears to be shifting back toward broadening expansion with easing supply constraints, supporting a more constructive, though still data-dependent, outlook.
Market Performance
Labor Market (Jobs)
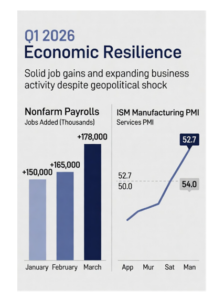
The labor market remained resilient and broadly balanced throughout the quarter. March nonfarm payrolls increased by 178,000, well above expectations, while the unemployment rate held steady near 4.3%. Gains were concentrated in health care, construction, and transportation — sectors that are typically sensitive to underlying economic activity. Importantly, there was little evidence of either overheating or deterioration.
Wage pressures remained contained, and hiring continued at a pace consistent with steady, sustainable growth. Taken together, the labor data reinforces the view that the economy entered and navigated the geopolitical shock from a position of strength.
(Source: U.S. Bureau of Labor Statistics – Employment Situation Summary, March 2026)
PMI (Business Activity)
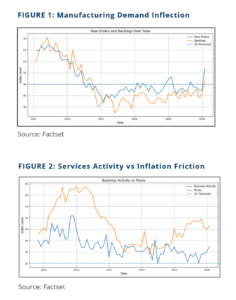
Both manufacturing and services sectors stayed firmly in expansion:
- ISM Manufacturing PMI: 50.7 in March (third consecutive month above 50, the strongest run since 2022)
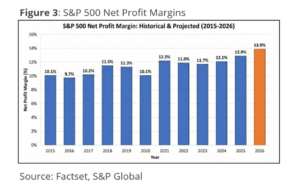
- ISM Services PMI: 53.0 in March (solidly expansionary, though down from 56.1 in February)
While respondents noted rising energy-related costs and some supply-side pressures, there was little indication of demand destruction. This distinction is important: the data point to a supply-driven inflation shock layered onto a still-expanding economy, rather than a slowdown in activity.
Inflation
 Inflation dynamics evolved meaningfully over the course of the quarter. Early in Q1, headline inflation remained relatively contained, with CPI at 2.4% year-over-year and core PCE around 3.1%. However, the late-quarter oil shock introduced a new source of pressure. Rising energy costs fed through to input prices, contributing to a repricing of inflation expectations and a modest increase in bond yields.
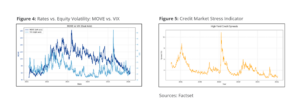
Market Resilience in Light of Current Events & Upward EPS Revisions
 The late-February Iran conflict escalation and Strait of Hormuz disruptions created a classic supply-shock scenario, spiking oil and commodities while initially pressuring risk assets. Despite this, markets proved resilient:
Outlook & Portfolio Implications
Looking ahead, the macro backdrop remains constructive, but the drivers of market performance are evolving. The economy continues to expand, supported by resilient labor markets, solid business activity, and positive earnings momentum. At the same time, the easing of the oil-driven inflation shock reduces the primary near-term risk to the outlook and reintroduces policy flexibility. This shift suggests a transition from a narrow, inflation-driven rotation toward a more balanced environment characterized by broader participation across sectors and styles.
From a portfolio perspective, this argues for rebalancing rather than repositioning. Cyclical exposure remains appropriate given the strength of the expansion, but the case for an outsized overweight to energy and other inflation beneficiaries has weakened as oil prices have retraced. Conversely, the headwinds facing duration-sensitive assets, particularly growth equities, are beginning to ease, creating opportunities to reintroduce exposure selectively.
Fixed income also becomes more balanced in this environment. With inflation pressures moderating at the margin, duration risk is less one-sided, and intermediate maturities may offer more attractive risk-adjusted opportunities. That said, the outlook remains contingent on several key factors. The durability of the geopolitical de-escalation, the trajectory of services inflation, and the behavior of credit markets will all play a critical role in determining whether the current improvement is sustained.
Key Sources:
J.P. Morgan Asset Management, Vanguard, Goldman Sachs Asset Management, and Evercore Wealth Management
U.S. Bureau of Labor Statistics – Employment Situation Summary (March 2026) and Consumer Price Index (February 2026); Institute for Supply Management – Manufacturing PMI Report (March 2026) and Services PMI Report (March 2026); FactSet – S&P 500 Earnings Season Preview, Q1 2026; Bloomberg, Reuters, and wire service reports on the Iran conflict and Strait of Hormuz developments (February–March 2026)